🚀 Build Process Watcher
Monitor memory usage and performance of your Gradle build processes in real-time with our powerful GitHub Action.
Default Mode
Generate Mermaid diagrams and SVG charts locally, uploaded as GitHub Actions artifacts:
- name: Build Process Monitoring
  uses: cdsap/build-process-watcher@v0.5.1

- name: Build project
run: ./gradlew clean buildRemote Mode
Enable live dashboard with real-time monitoring and GC metrics:
- name: Build Process Monitoring
  uses: cdsap/build-process-watcher@v0.5.1
  with:
    remote_monitoring: 'true'
    collect_gc: 'true'

- name: Build project
run: ./gradlew clean buildcollect_gc: 'true' to monitor garbage collection time in seconds. This adds a GC time chart to your dashboard.
How Remote Mode URL is Generated
When you enable Remote Mode, the action automatically generates a unique dashboard URL for your build run. This URL is displayed in the GitHub Actions output and allows you to monitor your build in real-time.
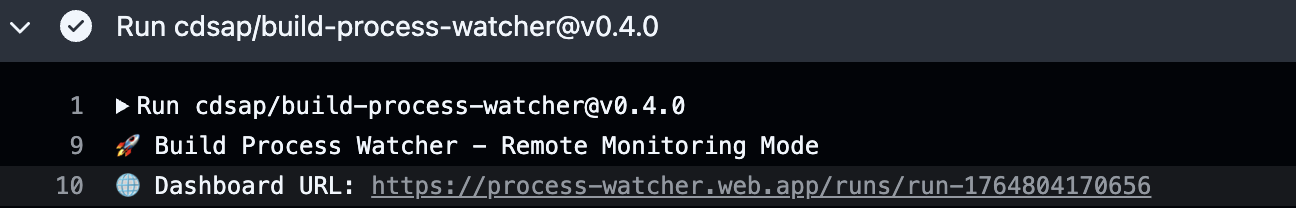
Example: The dashboard URL is automatically generated and displayed in the GitHub Actions log
- The action creates a unique run ID for each build
- A dashboard URL is automatically generated using this run ID
- The URL is displayed in the GitHub Actions output for easy access
- Data is available for 24 hours after the build completes
Live Example Dashboard
View a real Gradle build monitoring dashboard with live data from an actual build run.
Real data from run 18236843825 - 311 samples from GradleDaemon & KotlinCompileDaemon
This example demonstrates the Remote Mode dashboard with 24-hour data retention
Replay & Compare JSON
Analyze exported JSON runs offline. Replay a single run or compare two runs side-by-side.
Default Mode Output Examples
When using Default Mode, you'll get these outputs in your GitHub Actions artifacts:
📊 Mermaid Diagram
Interactive flowchart showing memory usage over time with process details
memory_usage.mermaid - Can be rendered in GitHub, GitLab, or any Mermaid-compatible viewer
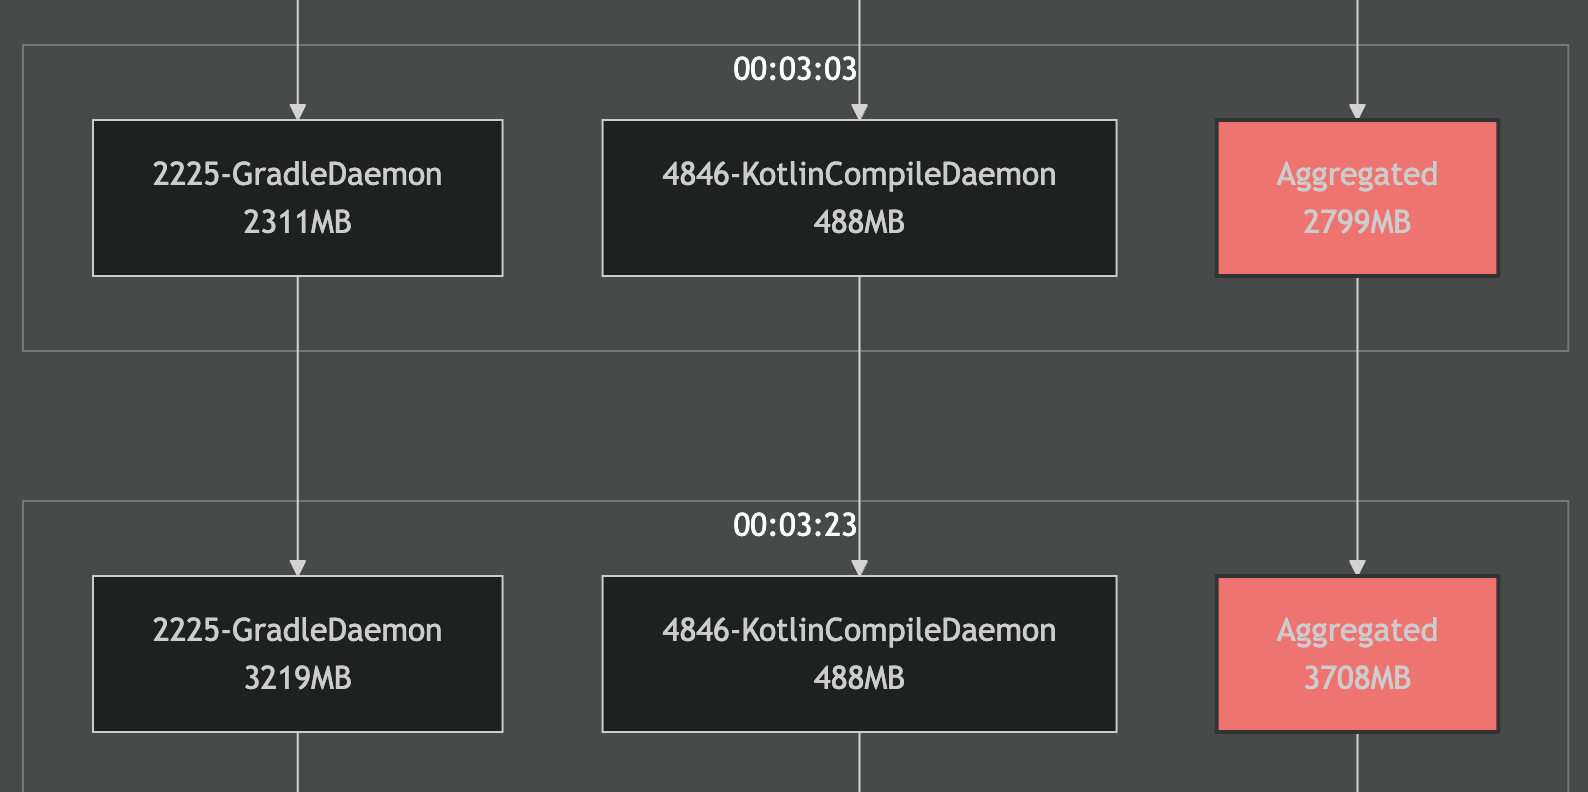
Example: Memory usage flowchart with process details
📈 SVG Chart
High-quality vector chart showing RSS and Heap usage with process-specific colors
memory_usage.svg - Scalable vector graphics perfect for documentation and reports
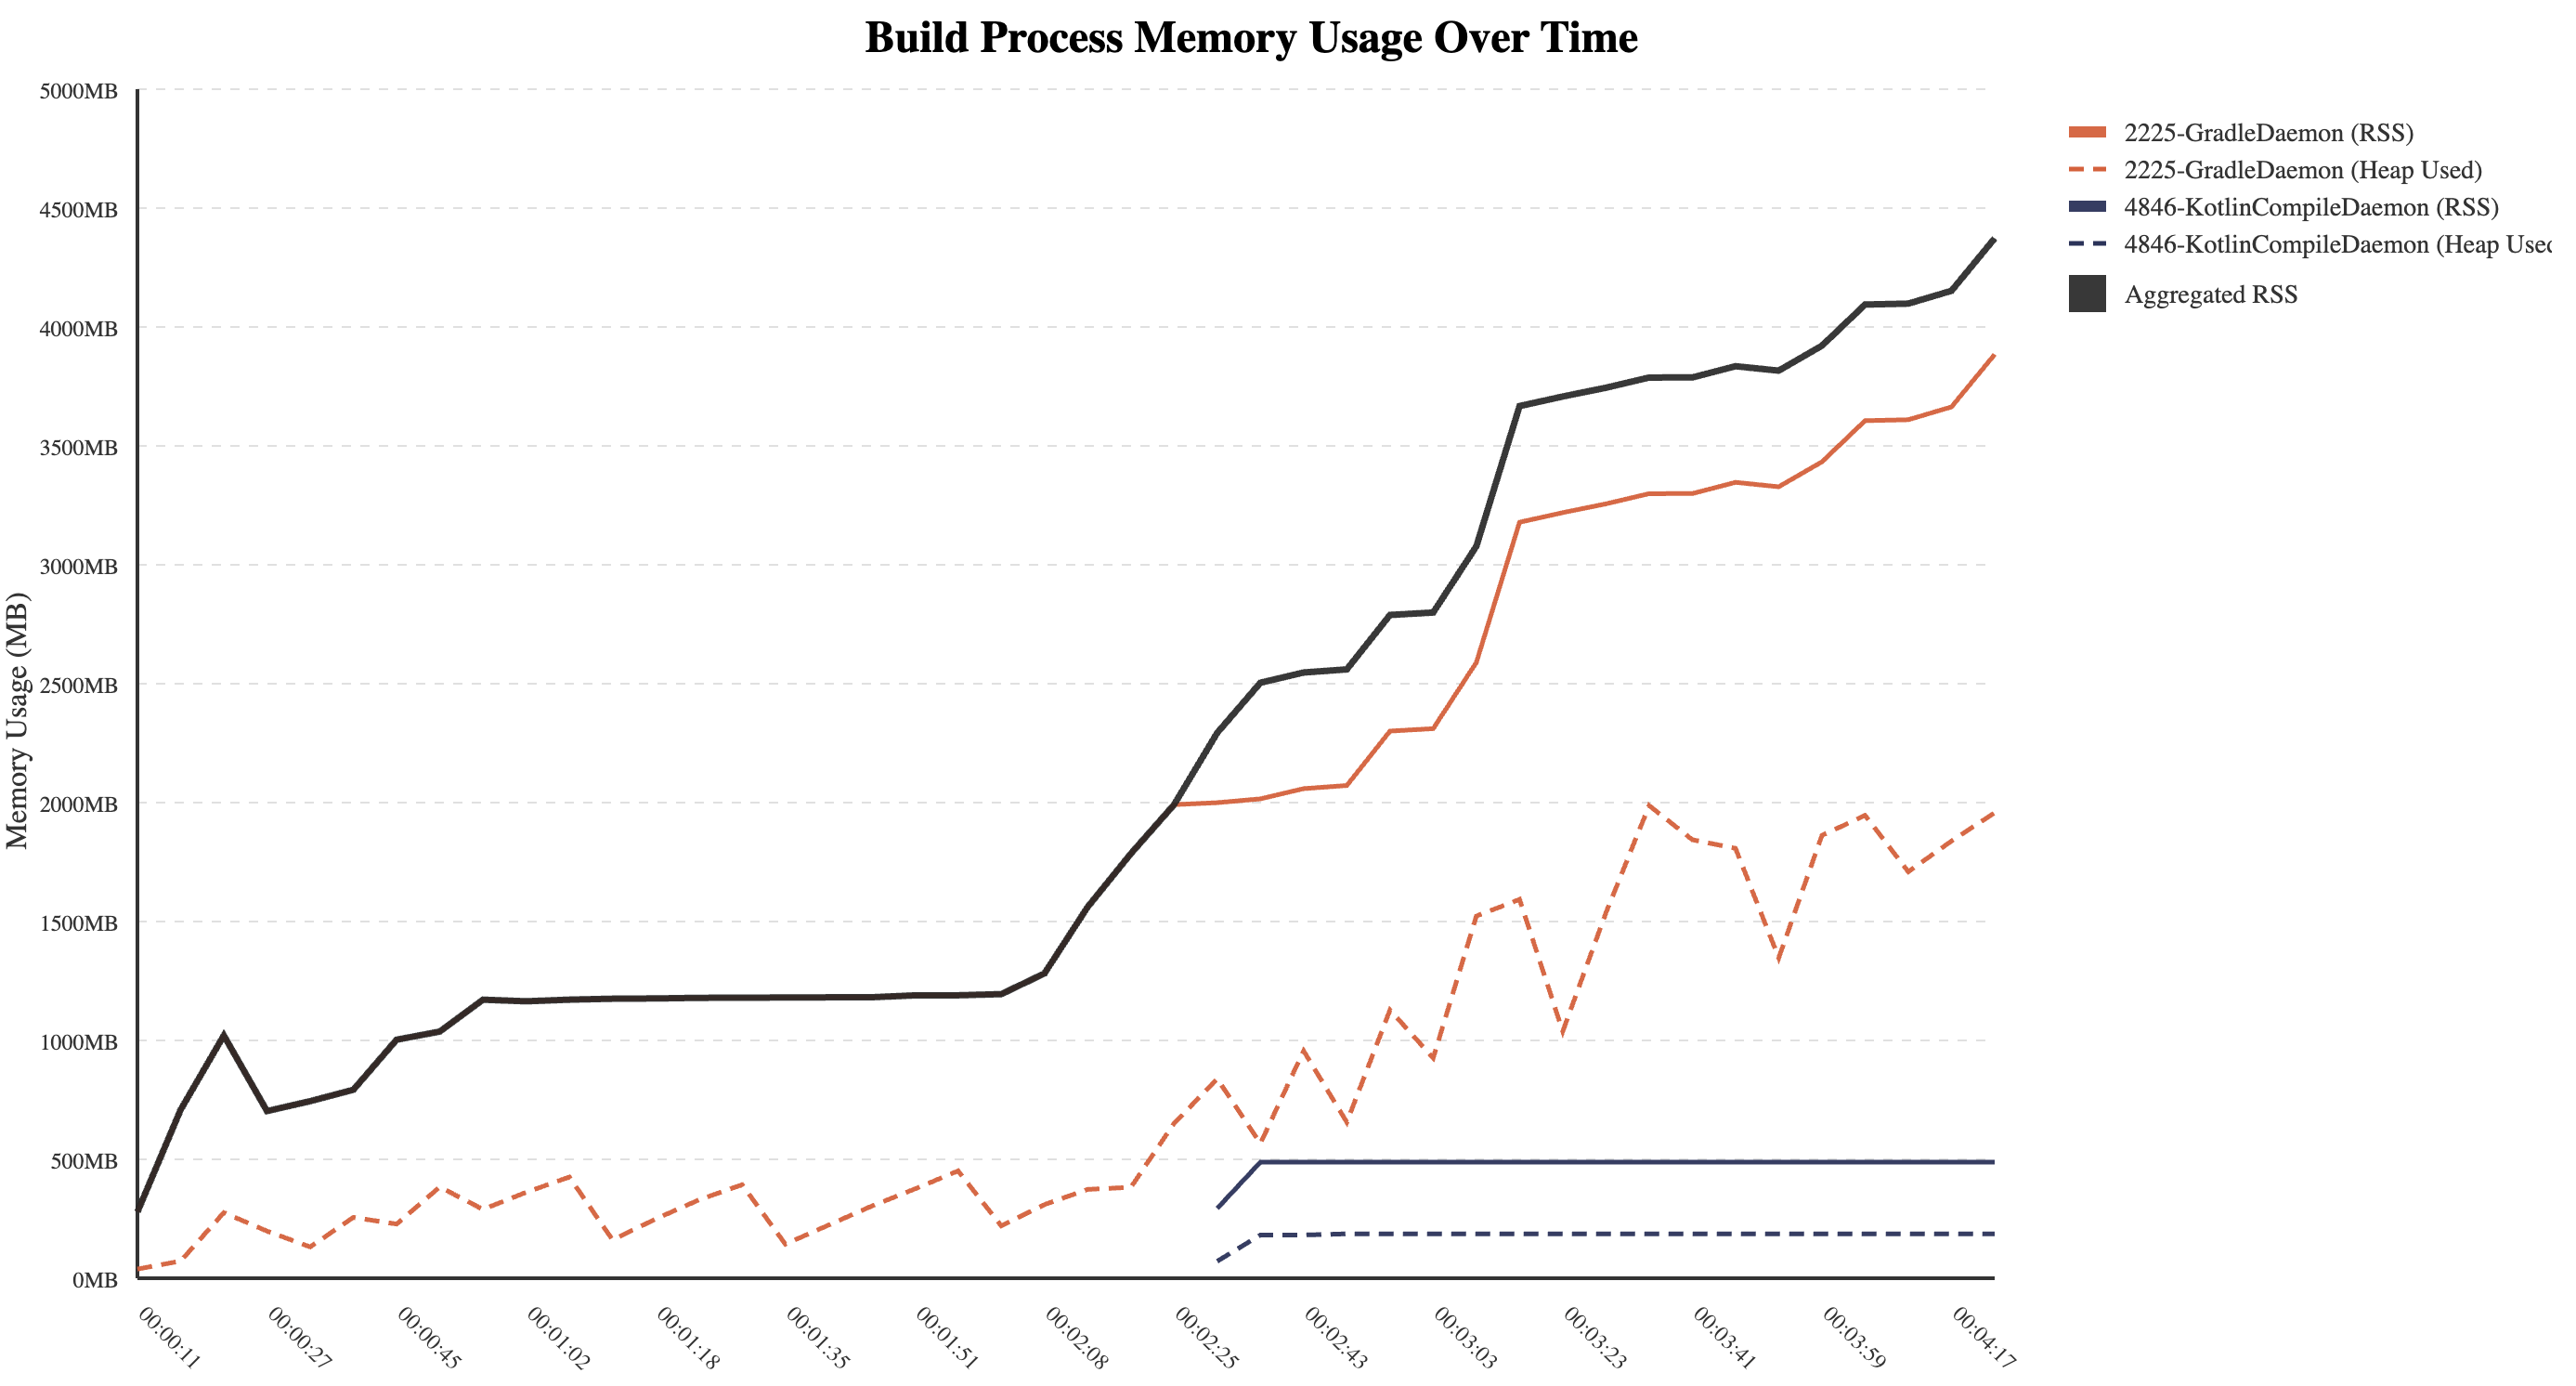
Example: RSS and Heap usage chart with process-specific colors
GC Metrics Collection
When using Remote Mode with collect_gc: 'true', you'll get a comprehensive GC time chart in your dashboard:
🔄 GC Time Chart
Track garbage collection performance over time to identify GC-related performance bottlenecks. GC time is displayed in seconds and works across all JVM GC collectors (Parallel, G1, Serial, CMS).
collect_gc: 'true' in your workflow to monitor GC time alongside memory usage
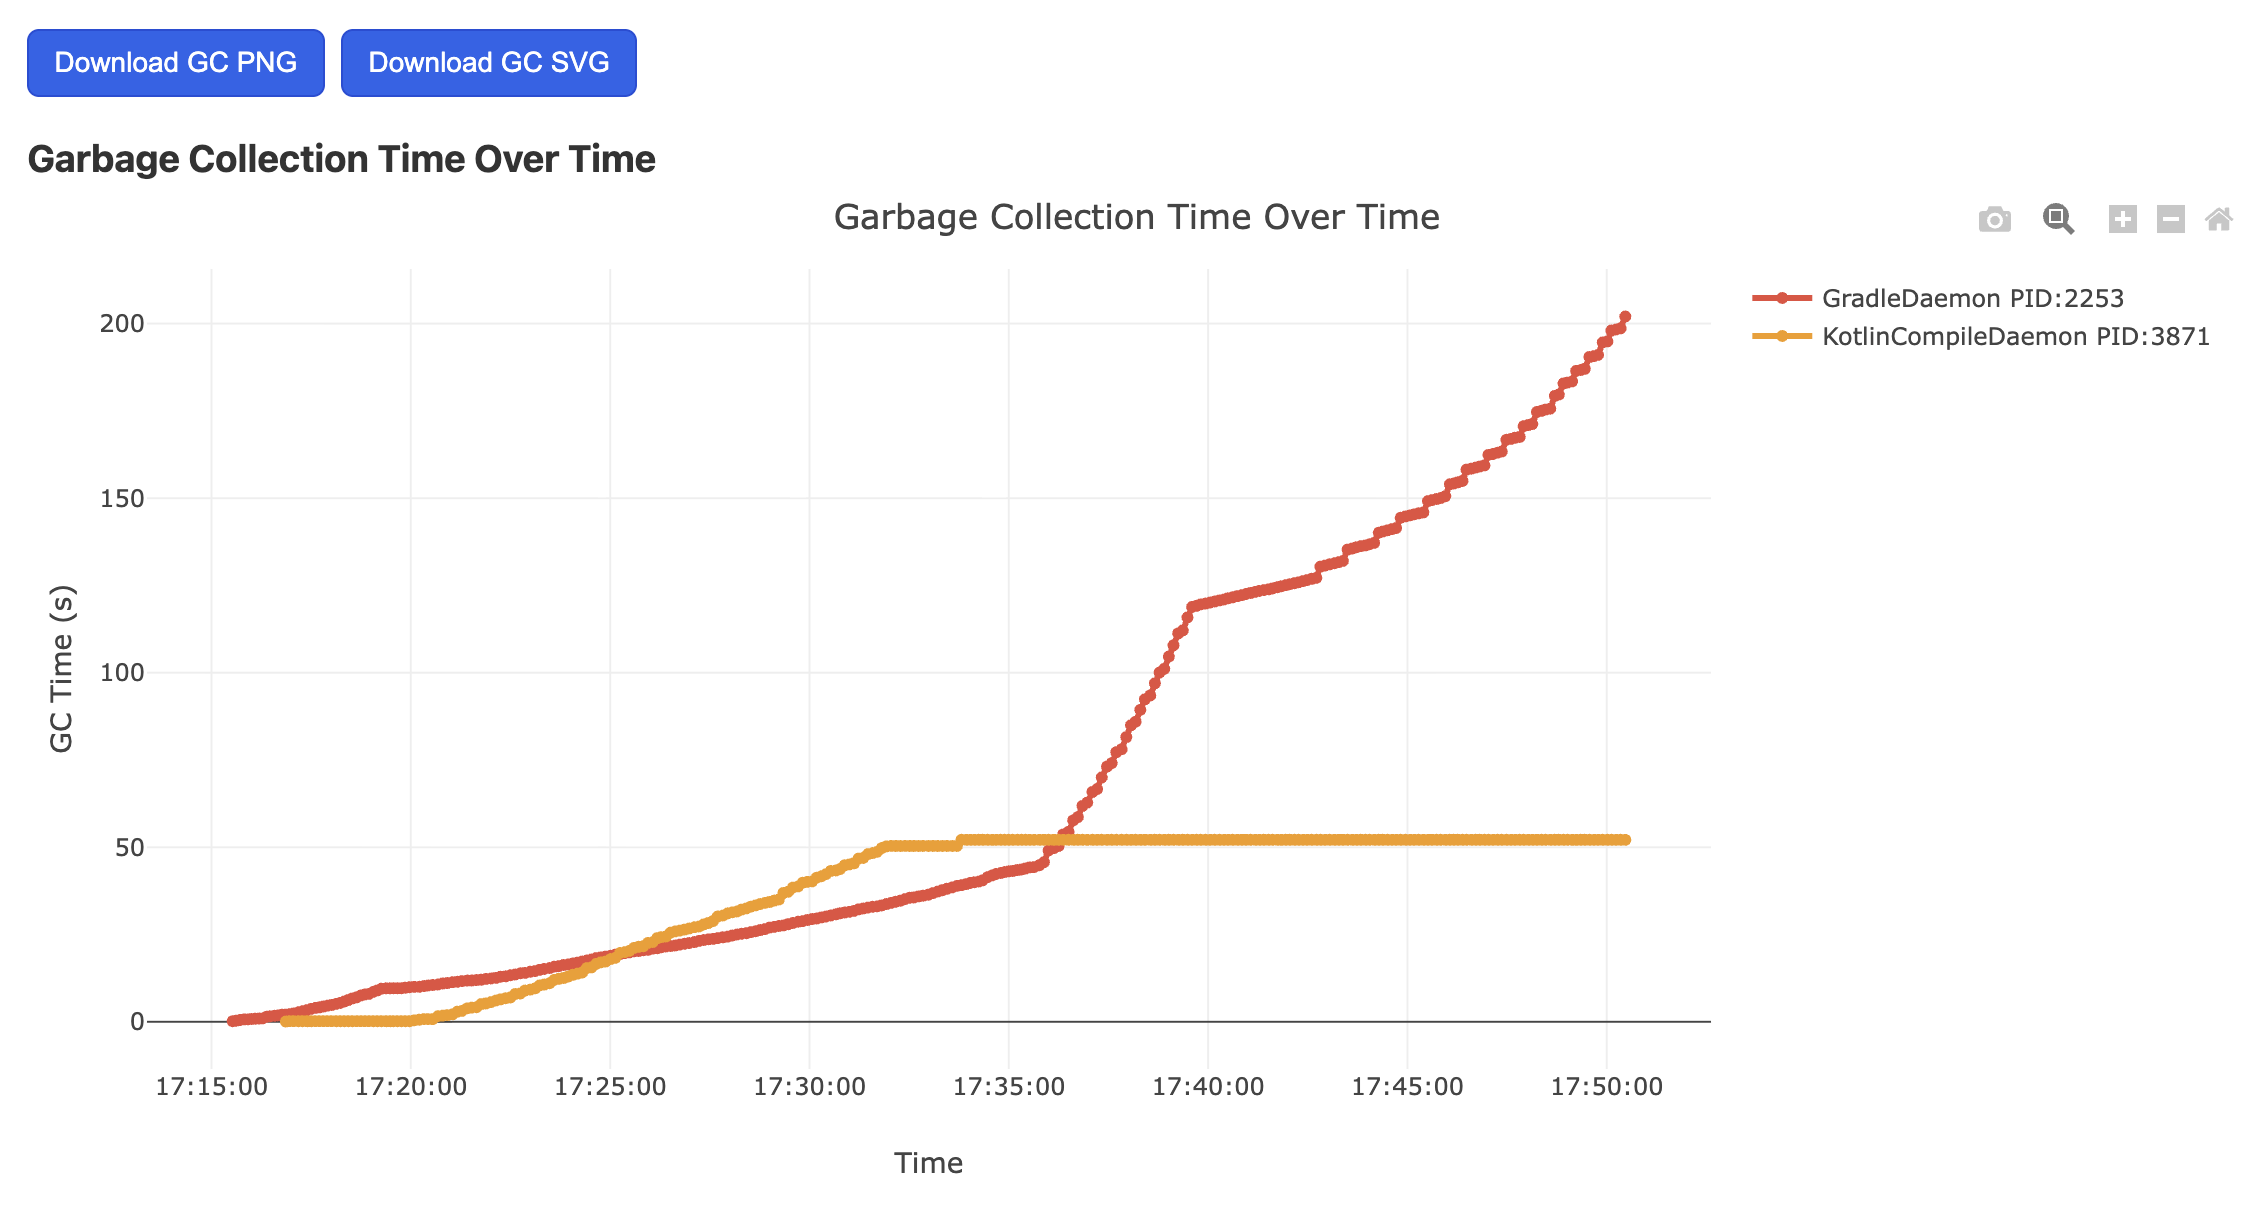
Example: GC time chart showing garbage collection performance over time
Key Features
📊 Default Mode
Generate Mermaid diagrams and SVG charts locally. Data is stored locally and uploaded as GitHub Actions artifacts.
🌐 Remote Mode
Check the current state of processes in real-time through our web dashboard. Data is stored in the cloud with 24-hour retention.
🔄 GC Monitoring
Track garbage collection performance with GC time charts. Enable collect_gc: 'true' to monitor GC-related performance issues.
Ready to Get Started?
Start monitoring your build processes today with just a few lines of code.